
How to Calculate a Business Break-Even Point
Calculate how many units a business must sell to cover fixed and variable costs before generating profit with practical formulas and break-even examples.
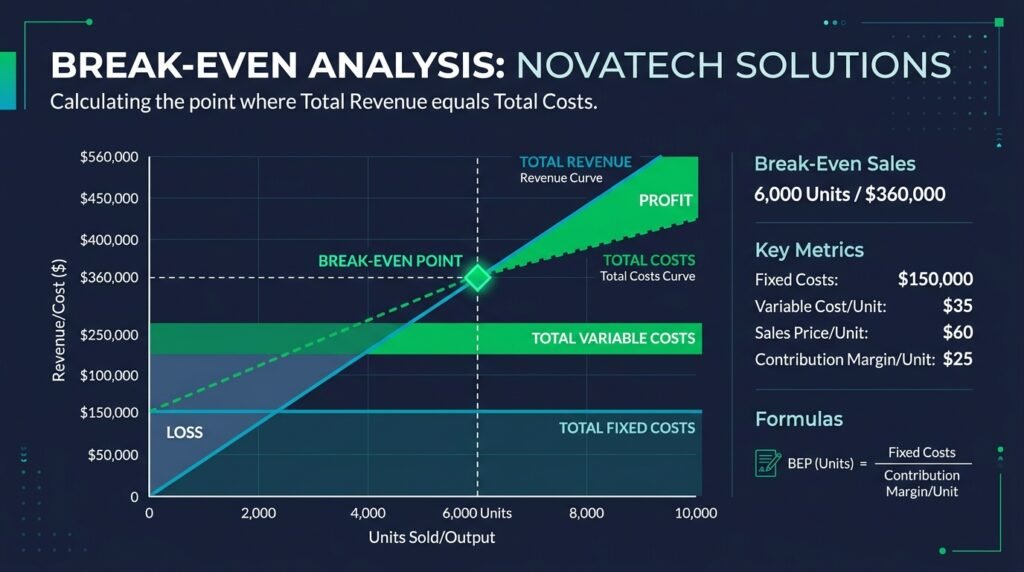
Every company, startup, and retail venture operates on an essential commercial threshold where total sales revenues balance operational expenses. Learning how to calculate break-even point metrics is one of the most critical financial capabilities an entrepreneur or commercial leader can master. At this exact junction, an enterprise has eliminated operating losses without yet accumulating taxable operating profits, marking the transition from capital consumption to wealth generation.
When leadership teams fail to evaluate commercial milestones accurately, ventures regularly succumb to undercapitalization and flawed pricing models. Conversely, knowing how to calculate break-even point figures empowers management to establish rigorous sales targets, optimize product pricing structures, and test commercial viability before risking significant financial capital.
To model business figures, simulate unit sales scenarios, and inspect production targets instantly inside your web browser, use EzzDo’s free Break-Even Calculator. For comprehensive return evaluations, pair your findings with EzzDo’s verified ROI Calculator and client-side Profit Margin Calculator to ensure complete fiscal clarity across your commercial roadmap.
Table of Contents
Break-Even Analysis at a Glance
Before exploring individual formulas, review this summary table of core metrics required to calculate break-even point values across manufacturing, retail, and service businesses:
| Metric | Formula | Operational Purpose | Example |
|---|---|---|---|
| Fixed Costs (FC) | Sum of overheads | Baseline expenses incurred regardless of sales | $10,000 / month |
| Variable Cost (VC) | Material + labor + shipping + fees | Incremental cost to deliver one unit | $30 per unit |
| Contribution Margin (CM) | Price − Variable Cost | Amount per unit to pay fixed overhead | $50 − $30 = $20 |
| Contribution Margin Ratio | Unit CM ÷ Selling Price | Profit margin as a share of revenue | $20 ÷ $50 = 40% |
| Break-Even Units | Fixed Costs ÷ Unit CM | Sales volume needed for zero loss | $10,000 ÷ $20 = 500 |
| Break-Even Revenue | Units × Price (or FC ÷ CMR) | Sales turnover required to cover costs | 500 × $50 = $25,000 |
| Target Profit Units | (FC + Target Profit) ÷ CM | Sales required for specific net income | ($10k + $5k) ÷ $20 = 750 |
What Is a Business Break-Even Point?
The break-even point is the level of sales at which total revenue equals total costs. At break-even, the business has not generated a profit, but it has also not produced a loss. To properly calculate break-even point benchmarks, guidelines by the U.S. Small Business Administration divide expenses into fixed and variable components.
Understanding break-even helps with product pricing, sales targets, budget planning, cost control, loan proposals, and launch decisions.
Understanding Fixed Costs
Fixed costs normally remain relatively stable even when the number of units sold changes. When teams prepare to calculate break-even point projections, identifying all ongoing overhead commitments is essential.
Common examples of fixed costs include:
- Rent and commercial real estate leases
- Business insurance premiums
- Salaried administrative and executive staff
- Software subscriptions and cloud hosting licenses
- Equipment and machinery leases
- Accounting, legal, and professional retainers
- Base utility charges and municipal connection fees
A business still incurs these baseline obligations when no products are sold. Because fixed costs are tied to operating calendar periods rather than production volume, they represent the financial hurdle an enterprise must overcome each month.
Understanding Variable Costs
Variable costs generally change in direct proportion to production or sales volume. When analysts calculate break-even point figures, isolating true per-unit direct expenses is critical for mathematical accuracy.
Examples of variable costs include:
- Direct materials and raw ingredients
- Primary product packaging, boxes, and protective wrap
- Per-unit manufacturing and direct assembly labor
- Outbound parcel shipping and freight delivery charges
- Sales commissions paid on completed transactions
- Credit card and electronic payment-processing fees
- Ecommerce platform and marketplace surcharges
The more units the business sells, the higher the total variable cost normally becomes. If zero units are manufactured, variable costs drop to zero.
Semi-Variable and Stepped Costs
In operating businesses, several expenditures possess both fixed and variable characteristics. Known as semi-variable or mixed costs, these include utilities with standing base charges plus metered consumption fees, or sales personnel earning a fixed base salary supplemented by variable commissions.
Additionally, growing enterprises encounter stepped fixed costs. These outlays remain constant within a specific production band but step up abruptly once facility or equipment limits are reached. A leased warehouse may accommodate up to 10,000 units monthly; exceeding that volume requires leasing additional space. When founders calculate break-even point projections during operational expansions, recognizing stepped costs prevents sudden cash shortages.
Contribution Margin per Unit
The contribution margin is the amount each individual sale contributes toward paying fixed costs and eventually generating profit. Without a positive contribution margin, it is mathematically impossible to calculate break-even point recovery.
The formula for unit contribution margin is:
Contribution Margin per Unit = Selling Price per Unit − Variable Cost per Unit
Suppose a commercial product sells for $50.00 and has a direct variable cost of $30.00:
Contribution Margin = $50.00 − $30.00 = $20.00
Each completed sale contributes exactly $20.00 toward extinguishing periodic fixed costs. Understanding this relationship is the primary step required to calculate break-even point requirements.
How to Calculate Break-Even Point in Units
The foundational formula to calculate break-even point volume in physical units divides total periodic fixed costs by the individual unit contribution margin:
Break-Even Units = Fixed Costs ÷ Contribution Margin per Unit
Let us review a standard business scenario:
- Fixed costs: $10,000.00 per month
- Selling price per unit: $50.00
- Variable cost per unit: $30.00
First, calculate contribution margin:$50.00 − $30.00 = $20.00
Next, use the formula to calculate break-even point units:$10,000.00 ÷ $20.00 = 500 units
The enterprise must sell exactly 500 units during the period to cover its overhead. Selling 501 units yields positive operating profit, while selling 499 units results in an operational deficit. Tracking these unit targets provides production teams with clear operational milestones.
How to Calculate Break-Even Point in Revenue
Commercial lenders and corporate finance managers often evaluate dollar-denominated turnover. Break-even revenue can be calculated directly by multiplying break-even units by unit selling price:
Break-Even Revenue = Break-Even Units × Selling Price
Using our baseline numbers:500 units × $50.00 = $25,000.00
The business reaches break-even at $25,000.00 in revenue, assuming entered cost assumptions remain accurate. Total incoming revenue covers $15,000.00 in variable costs (500 × $30.00) plus $10,000.00 in fixed overhead. Being able to calculate break-even point revenue provides accounting executives with concrete billing goals. When you calculate break-even point milestones in both units and revenue, leadership gains complete operational visibility.
Contribution Margin Ratio
For service firms, retailers, and ecommerce shops selling hundreds of diverse products, calculating unit break-even volume for each item is impractical. Instead, finance professionals use the contribution margin ratio to calculate break-even point revenue across entire product catalogs:
Contribution Margin Ratio = (Selling Price − Variable Cost) ÷ Selling Price
Using our baseline numbers:($50.00 − $30.00) ÷ $50.00 = $20.00 ÷ $50.00 = 0.40 (40.0%)
The contribution margin ratio is 40%. Break-even revenue can then be calculated as:
Break-Even Revenue = Fixed Costs ÷ Contribution Margin Ratio$10,000.00 ÷ 0.40 = $25,000.00
As documented in corporate finance standards by the Corporate Finance Institute, this ratio enables financial officers to calculate break-even point requirements rapidly across diverse commercial departments.
Adding a Target Profit
While achieving break-even prevents losses, businesses operate to generate profit. To estimate the sales volume required for a specific net income target, treat desired profit as an additional fixed cost:
Required Units = (Fixed Costs + Target Profit) ÷ Contribution Margin per Unit
If the business seeks a monthly operating profit of $5,000.00:($10,000.00 + $5,000.00) ÷ $20.00 = 750 units
Selling 750 units generates $37,500.00 in gross revenue. Adapting formulas to calculate break-even point requirements with profit targets aligns sales quotas with investor return expectations.
Multi-Product Break-Even Calculations
When an enterprise sells multiple product lines, managers must calculate break-even point quotas using a sales-mix weighted average contribution margin. For example, consider an enterprise selling standard items ($16 CM, 60% of sales) and premium items ($36 CM, 40% of sales) with $24,000 in monthly fixed overhead:
- Standard Line CM: $16.00 × 0.60 = $9.60
- Premium Line CM: $36.00 × 0.40 = $14.40
- Weighted Average CM: $9.60 + $14.40 = $24.00 per unit
The composite break-even requirement is:$24,000.00 ÷ $24.00 = 1,000 total composite units (600 standard and 400 premium units).
Cash vs Accounting Break-Even
A common mistake is assuming accounting break-even ensures bank liquidity. Accrual fixed expenses include non-cash charges like depreciation, which do not consume cash.
Conversely, debt principal repayments require cash but do not appear as operating expenses on income statements. To determine cash survival thresholds, executives calculate break-even point figures on a strict cash basis:
Cash Break-Even = (Fixed Costs − Depreciation + Debt Principal Payments) ÷ Unit CM
A company might record an accounting loss on paper while remaining liquid and cash-flow positive. Evaluating both metrics guarantees comprehensive financial health.
Why Real Results May Differ
A break-even calculation is only as accurate as its underlying cost and pricing inputs. When managers calculate break-even point projections, real-world operating conditions often change dynamically.
Real-world results may change because of:
- Discounts: Promotional pricing lowers realized unit selling prices.
- Product returns: Restocking expenses and refunded shipping erode margins.
- Cost increases: Unforeseen supplier price hikes inflate variable expenses.
- Taxes: Tariff changes and local business taxes increase overhead.
- Multiple prices: Wholesale allowances alter average unit revenue.
- Changing commissions: Tiered sales incentives shift variable expenditures.
- Seasonal expenses: Peak utility spikes elevate monthly fixed overhead.
- Damaged inventory: Shrinkage and spoilage reduce saleable units.
- Unexpected overhead: Unplanned equipment repairs expand fixed burdens.
- Different product mixes: Shifts toward low-margin items depress average margins.
Review break-even models regularly instead of treating them as static permanent results.
Break-Even Point vs ROI and Profit Margin
Business owners frequently evaluate commercial opportunities using three related indicators: break-even point, return on investment (ROI), and profit margin. Each metric evaluates performance through a unique financial lens:
- Break-Even Point: Identifies when total revenue covers total operational costs (measured in units or revenue).
- Return on Investment (ROI): Measures the percentage gain or loss generated relative to the invested capital.
- Profit Margin: Quantifies the percentage of sales revenue remaining after satisfying operating expenses.
A venture may break even rapidly yet produce a modest ROI due to substantial initial capital outlays. Use EzzDo’s free ROI Calculator to assess investment returns and the client-side Profit Margin Calculator to evaluate percentage profitability after you calculate break-even point thresholds.
Common Break-Even Mistakes to Avoid
Avoiding implementation pitfalls ensures financial forecasts remain dependable. When you calculate break-even point projections, watch for these common mistakes:
- Confusing Gross Margin with Contribution Margin: Gross margin includes factory depreciation, while contribution margin strictly isolates direct variable costs.
- Forgetting Payment Processing Fees: Omitting credit card fees (2.9% + $0.30) artificially inflates perceived unit contribution.
- Assuming Linear Costs: Overlooking stepped costs causes deficits when production expands into higher facility tiers.
- Ignoring Return Rates: Failing to account for refunds and return shipping inflates projected net volumes.
- Excluding Executive Salaries: Treating founder compensation as optional distributions produces unrealistically low break-even thresholds.
- Overlooking Sales Mix Variance: Using simple catalog averages rather than sales-weighted margins skews forecasts.
- Neglecting Cash Flow Timing: Forgetting that 60-day invoice terms delay cash receipts even when sales break even.
How to Use EzzDo’s Break-Even Calculator
To eliminate manual arithmetic errors and simulate scenarios effortlessly, use EzzDo’s free in-browser utility. Follow these simple steps to calculate break-even point values using EzzDo’s Break-Even Calculator:
- Input Fixed Costs: Enter total periodic operating expenses (rent, insurance, baseline salaries, and software).
- Enter Unit Variable Cost: Enter direct material, labor, shipping, and transaction fees incurred per unit.
- Set Unit Selling Price: Enter your net realized price per unit after promotional allowances.
- Add Optional Target Profit: Enter any desired operating profit target to model expansion requirements.
- Review Instant Results: The tool immediately calculates contribution margin, break-even units, and revenue milestones.
Because EzzDo’s utilities execute client-side in browser memory, your private financial data is never transmitted to external servers. Use EzzDo whenever you model commercial break-even projections with total privacy.
Strategic Decisions Driven by Break-Even Analysis
Cost-volume-profit audits guide strategic choices across corporate lifecycles. Review this matrix illustrating how commercial leaders leverage data when they calculate break-even point metrics:
| Business Situation | Analytical Method | Strategic Decision Outcome |
|---|---|---|
| New Product Launch | Compare tooling outlays against unit margins | Proceed only if market demand exceeds required break-even unit volume. |
| Hiring Staff | Divide salary by current unit contribution margin | Establishes exact incremental sales volume required to fund new personnel. |
| Facility Leases | Incorporate higher lease expense into fixed overhead | Determines revenue expansion needed before signing commercial leases. |
| Price Discounts | Recalculate compressed unit contribution margins | Reveals whether anticipated volume growth can overcome lower margins. |
Frequently Asked Questions
Can break-even units include a fraction?
A calculation may produce a decimal (such as 412.3 units), but physical products require rounding up to the next complete unit (413 units). Selling 412 units leaves an operational deficit.
What if variable cost is higher than the selling price?
The contribution margin is negative. Selling additional units increases the operating loss. It is mathematically impossible to calculate break-even point recovery until pricing or costs are restructured.
Is owner salary a fixed cost?
Yes. Owner compensation should be treated as a fixed operating cost in standard business modeling. Excluding owner salaries produces an artificially low break-even target.
Does break-even guarantee enough cash?
No. Cash-flow timing, debt principal payments, inventory purchases, and payment delays can create cash shortages even when an accounting break-even target is reached. Always calculate break-even point metrics on a cash basis alongside accounting figures.
How does the Margin of Safety protect a business?
The Margin of Safety measures the percentage buffer between actual sales and the break-even baseline. It indicates how much revenue can contract during downturns before the company incurs losses.
How often should leadership calculate break-even point thresholds?
Businesses should review break-even metrics quarterly or whenever supplier prices, utility tariffs, labor contracts, or facility leases change significantly.
Final Break-Even Implementation Checklist
Before launching marketing campaigns or finalizing budgets, review this operational checklist to ensure financial precision when you calculate break-even point targets:
- Include all recurring overhead, rent, and software licenses in fixed costs.
- Include direct packaging, freight, and gateway fees in unit variable costs.
- Base calculations on net realized selling prices after customer discounts.
- Confirm contribution margin per unit is positive.
- Always round fractional unit requirements up to the next whole number.
- Compute break-even in both unit sales volume and gross revenue turnover.
- Identify stepped cost plateaus where scaling triggers new facility expenses.
- Differentiate cash break-even from accounting break-even by factoring debt service.
- Verify calculations with EzzDo’s verified Break-Even Calculator and Profit Margin Calculator.
Mastering Your Business Break-Even Point
Learning how to calculate break-even point metrics transforms commercial planning from speculative guesswork into an empirical management discipline. Knowing your operational break-even threshold establishes the foundation for pricing integrity, marketing investment limits, and sustainable corporate expansion.
By conducting regular cost-volume-profit audits and tracking contribution margin ratios, business leaders can navigate shifting market conditions with clarity and confidence. Whenever you need to evaluate unit targets or simulate growth scenarios with complete privacy, bookmark EzzDo’s free Break-Even Calculator, verify capital returns with the ROI Calculator, and calibrate margins with the Profit Margin Calculator today.