
Profit Margin vs Markup: Formulas and Examples
Learn why profit margin and markup produce different percentages and how to calculate prices, profit and conversions correctly.
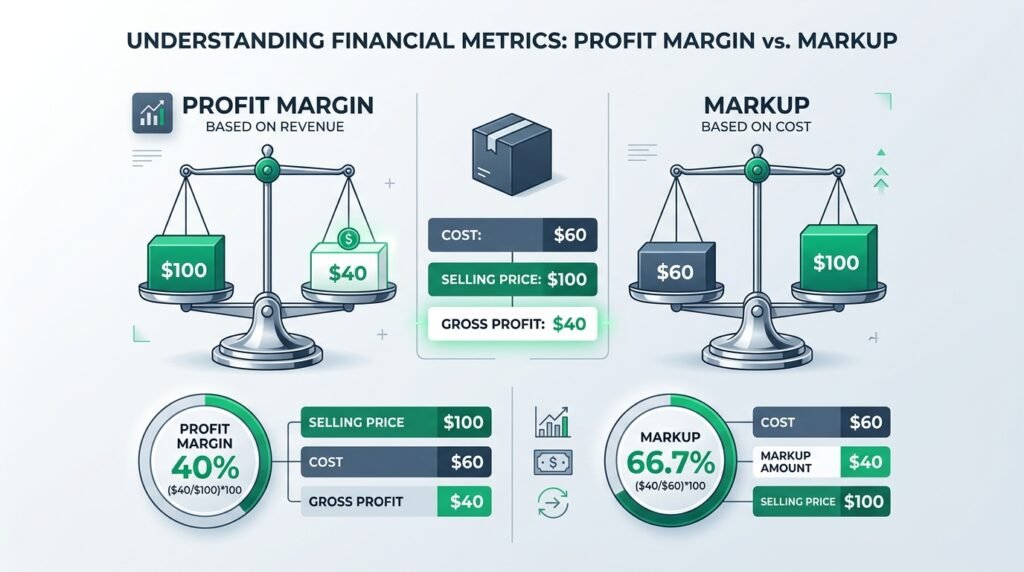
Understanding profit margin vs markup is a critical pricing skill for retailers, ecommerce merchants, and financial managers. Although both metrics evaluate profitability, they assess returns through different baselines. Profit margin measures the share of revenue retained after paying costs, while markup shows how much is added to cost to set a price. Conflating these calculations causes underpricing and distorted profitability reporting.
To price goods profitably, businesses must master unit cost, selling price, revenue, and gross profit. In commercial planning, analyzing profit margin vs markup ensures that shelf prices cover operating expenses. In this guide, you will learn the exact formulas, pricing examples, conversion methods, and spreadsheet equations needed to price with confidence. You can also test pricing instantly using EzzDo’s free Profit Margin Calculator.
Table of Contents
Profit Margin vs Markup: The Key Difference
The core principle in profit margin vs markup lies in the denominator. Margin compares profit with revenue, whereas markup compares profit with cost. Because revenue exceeds cost in profitable sales, dividing profit by revenue yields a lower percentage than dividing by cost.
While both formulas use identical profit amounts, their percentages reflect distinct insights. Margin measures retained sales revenue for reporting, whereas markup shows how much cost is increased to set shelf prices. In commercial analysis, mastering profit margin vs markup prevents fatal pricing errors.
| Measurement | Formula | Denominator | What It Communicates | Common Use |
|---|---|---|---|---|
| Profit Margin | (Profit ÷ Selling Price) × 100 | Selling Price | Percentage of revenue kept as profit | Financial statements and budgeting |
| Markup | (Profit ÷ Cost) × 100 | Product Cost | Percentage added to cost to set price | Retail shelf pricing and bids |

What Is Gross Profit?
Before computing percentage metrics, business operators must determine gross profit as an absolute dollar amount. Gross profit measures earnings remaining after subtracting direct inventory procurement or manufacturing costs:
Gross Profit = Selling Price − Cost
If an enterprise purchases merchandise for $60 and sells it for $100, gross profit equals $100 − $60 = $40. This exact $40 profit serves as the numerator in both calculations. When evaluating profit margin vs markup, each formula divides this $40 return by a different denominator. Businesses must distinguish gross profit in dollars ($40) from gross profit margin as a percentage (40%).
Profit Margin Formula
The standard equation for profit margin expresses dollar profit as a percentage of total selling price or revenue:
Profit Margin = (Profit ÷ Selling Price) × 100
Applying this formula to our $60 cost and $100 selling price gives ($40 ÷ $100) × 100 = 40%. This 40% profit margin reveals that your business retains 40 cents of profit from every dollar collected, while 60 cents covers product costs. This represents gross margin before operating overhead, wages, and taxes. In commercial benchmarking, understanding profit margin vs markup ensures that revenue forecasts accurately reflect retainable funds. For another example, a maker with $150 cost and $250 selling price earns $100 profit, delivering ($100 ÷ $250) × 100 = 40% margin.
Markup Formula
While profit margin looks downward from revenue, markup looks upward from cost. The markup formula determines what percentage of product cost is added to establish customer price:
Markup = (Profit ÷ Cost) × 100
Applying this to our $60 cost and $100 selling price benchmark gives ($40 ÷ $60) × 100 = 66.67%. This explains why the exact same product features a 40% margin alongside a 66.67% markup. The seller adds 66.67% of cost ($40) on top of cost to reach $100. When comparing profit margin vs markup, the $40 return represents 40% of sales revenue, but 66.67% of initial cost. In another case, buying items for $50 and selling for $80 ($30 profit) yields a 60% markup and 37.5% margin.
Why Margin and Markup Produce Different Percentages
The mathematical divergence between these metrics stems from their different baselines: margin compares profit with customer selling price, whereas markup compares profit with original product cost. Because selling price is higher than cost in every profitable sale, dividing dollar profit by selling price always yields a lower percentage than dividing it by cost.
Consequently, markup is normally numerically higher than the corresponding profit margin when cost and profit are positive. For example, a 25% markup delivers a 20% margin, while a 100% markup yields a 50% margin. Neither measurement is inherently superior. Evaluating profit margin vs markup side-by-side provides total pricing visibility.
Example of Pricing a Product with Markup
To see how pricing with markup operates in retail, examine this practical example. An online seller buys headphones for $80 and applies a 25% markup: Markup Amount = $80 × 25% = $20, establishing a Selling Price = $80 + $20 = $100. Calculating the resulting profit margin gives: Margin = ($20 ÷ $100) × 100 = 20%.
Notice that a 25% markup produces a 20% profit margin, not a 25% margin. Assuming a 25% markup delivers a 25% margin leaves businesses falling 5 percentage points short on revenue retention. When analyzing profit margin vs markup, this difference directly affects cash reserves. Similarly, items costing $50 with a 40% markup sell for $70 ($20 profit), delivering a 28.57% margin.
Calculating Selling Price from a Target Margin
When businesses must meet fixed overhead requirements, pricing products to achieve a target profit margin is more effective than adding arbitrary markups. To calculate selling price from a target margin, use this formula:
Selling Price = Cost ÷ (1 − Target Margin)
The target margin must be entered as a decimal. If an item costs $80 and your company requires a 25% margin (0.25): Selling Price = $80 ÷ (1 − 0.25) = $80 ÷ 0.75 = $106.67. Gross profit equals $106.67 − $80 = $26.67, confirming ($26.67 ÷ $106.67) × 100 = 25.00% margin. Multiplying cost by 1.25 would produce only $100, leaving an inadequate 20% margin. In profit margin vs markup planning, this formula protects gross income.
Converting Markup into Margin
When suppliers provide price lists with stated markups, procurement teams must convert those markups into margin percentages to assess real profitability. The conversion formula is:
Margin = Markup ÷ (1 + Markup)
For example, converting a 50% markup (0.50) into profit margin gives: Margin = 0.50 ÷ (1 + 0.50) = 0.50 ÷ 1.50 = 33.33%. An item costing $100 with a 50% markup sells for $150 ($50 profit), and dividing $50 profit by $150 revenue confirms a 33.33% margin. In commercial transactions, understanding profit margin vs markup conversions allows instant evaluation of vendor proposals.
Converting Margin into Markup
Conversely, when corporate financial targets require a specific gross profit margin, pricing managers must calculate the required markup on cost. Use this reciprocal equation:
Markup = Margin ÷ (1 − Margin)
If management sets a target margin of 40% (0.40), the necessary markup on cost is: Markup = 0.40 ÷ (1 − 0.40) = 0.40 ÷ 0.60 = 66.67%. Adding a 66.67% markup ($40) on our $60 benchmark cost produces the required $100 price and 40% margin. In commercial pricing, converting profit margin vs markup ensures that field quotes align with corporate targets.
Margin and Markup Conversion Table
To speed up commercial negotiations and catalog updates, consult this mathematically verified conversion reference table:
| Markup on Cost | Equivalent Profit Margin | Cost Basis | Selling Price | Gross Profit |
|---|---|---|---|---|
| 10% | 9.09% | $100.00 | $110.00 | $10.00 |
| 20% | 16.67% | $100.00 | $120.00 | $20.00 |
| 25% | 20.00% | $100.00 | $125.00 | $25.00 |
| 50% | 33.33% | $100.00 | $150.00 | $50.00 |
| 66.67% | 40.00% | $100.00 | $166.67 | $66.67 |
| 100% | 50.00% | $100.00 | $200.00 | $100.00 |
| 200% | 66.67% | $100.00 | $300.00 | $200.00 |
Minor variations in real transactions result from decimal rounding, but the mathematical relationship remains constant. In everyday commercial operations, referencing this profit margin vs markup table prevents misquoted contractor estimates and preserves target profit.
Costs Businesses Commonly Forget
Many businesses experience cash shortfalls because they calculate markups strictly against invoice purchase prices while ignoring secondary fulfillment expenses. Setting viable prices requires incorporating true landed costs. Key costs that frequently erode gross earnings include: direct inbound shipping and tariffs, product packaging, payment gateway surcharges (2.9% plus $0.30), marketplace channel fees (8% to 15%), warehouse pick-and-pack expenses, and customer returns.
While standard accounting does not place every operating expense into Cost of Goods Sold, pricing managers must include transaction-level variable costs in unit calculations. When analyzing profit margin vs markup, accounting for these expenses prevents paper profits from turning into actual losses.
Gross Margin vs Net Margin
To evaluate overall enterprise viability, executives must separate gross margin from net margin: Gross Margin measures direct product profitability after Cost of Goods Sold; Operating Margin measures earnings after overhead like rent and administrative wages; and Net Margin reflects final bottom-line earnings after taxes and interest.
The formulas discussed in our primary examples measure gross profit. A company can maintain a healthy 50% gross margin yet produce a negative net margin if administrative salaries and advertising absorb 55% of revenue. When reviewing profit margin vs markup reports, always clarify whether colleagues are discussing gross product performance or net business income.
Profit Margin, Markup and ROI
Business operators frequently use margin, markup, and Return on Investment (ROI) to guide commercial strategy. While margin measures profit relative to revenue and markup measures profit relative to cost, ROI measures net financial gain relative to total invested capital.
When planning inventory investments, using specialized financial tools ensures sound decision-making. To project capital efficiency across multi-month campaigns, use EzzDo’s free ROI Calculator. To determine the sales volume required before gross profits cover fixed monthly overheads, utilize the Break-Even Calculator. Combining these tools with profit margin vs markup calculations gives businesses a robust pricing foundation.
Common Profit Margin vs Markup Mistakes
To protect company cash flow, avoid these ten common pricing errors when working with profit margin vs markup:
- Treating Markup as Margin: Assuming a 30% markup yields a 30% margin (actual: 23.08%).
- Dividing by Cost for Margin: Dividing profit by cost instead of selling price.
- Dividing by Revenue for Markup: Dividing profit by revenue instead of cost.
- Forgetting Transaction Fees: Omitting payment processing and marketplace platform fees.
- Ignoring Discounts: Setting slim margins where promotional discounts cause losses.
- Confusing Margins: Treating gross product margins as bottom-line enterprise profit.
- Percentages as Integers: Entering 25 instead of 0.25 into formulas.
- Early Rounding: Rounding unit prices prematurely during bids.
- Uniform Markups: Applying identical markups across dissimilar merchandise.
- Overlooking Turnover: Assuming high markup guarantees profits despite slow sales.
Mastering Profit Margin vs Markup in Everyday Operations
Standardizing these pricing definitions across procurement, sales, and accounting ensures consistent profitability. When team members understand profit margin vs markup, pricing friction disappears and company cash reserves remain secure.
Practical Pricing Examples
Here are eight verified commercial pricing examples demonstrating real-world applications of profit margin vs markup:
1. Retail: Scarves bought for $20 sell for $50 ($30 profit). Markup = ($30 ÷ $20) × 100 = 150%. Margin = ($30 ÷ $50) × 100 = 60%.
2. Ecommerce: Cost of $18 plus $6 fees ($24 landed cost) sells for $40 ($16 profit). Markup on cost = 66.67%. Margin = 40%.
3. Service: A consultant pays $400 in contractor fees and bills $1,000 ($600 profit). Markup is 150%, delivering a 60% margin.
4. Wholesale: A distributor sells items for $80 ($60 cost, 33.33% markup). A retailer marks it up 50% to sell at $120 ($40 profit, 33.33% margin).
5. Discount: A $50 item retails at $100 (50% margin). Discounted 20% to $80, profit falls to $30 and margin drops to 37.5%.
6. Target Margin: A valve costing $120 with a 35% margin target sells for $120 ÷ (1 − 0.35) = $184.62 ($64.62 profit, 35% margin).
7. Luxury Goods: Silver jewelry costing $75 sells for $225 ($150 profit). Markup is 200%, yielding a 66.67% margin.
8. Commodity: Grain costing $46 sells for $50 ($4 profit). Markup is 8.70%, delivering an 8.00% margin. Evaluating profit margin vs markup across diverse goods ensures healthy cash generation.
How to Use the EzzDo Profit Margin Calculator
Simplify your pricing workflow and test unit economics instantly by following these eight steps in EzzDo’s online calculator:
- Open Tool: Access EzzDo’s free Profit Margin Calculator in your browser.
- Enter Cost: Input unit procurement or landed cost.
- Enter Price: Enter intended retail price or client estimate.
- Review Profit: Observe dollar profit generated per transaction.
- Review Margin: Verify percentage of revenue retained as gross profit.
- Review Markup: Check percentage added above cost to validate vendor pricing.
- Test Scenarios: Adjust numbers to test promotional pricing and discounts.
- Add Real Costs: Include shipping and merchant fees before finalizing prices.
Using this calculator eliminates manual arithmetic mistakes when evaluating profit margin vs markup during live business quoting.
Using Spreadsheets for Margin and Markup
For catalog pricing models and financial spreadsheets, use these standard formulas in Microsoft Excel or Google Sheets. Assuming cost is in cell A2 and selling price is in cell B2: Profit is =B2-A2, Margin is =(B2-A2)/B2, and Markup is =(B2-A2)/A2. To calculate selling price from a target margin in cell C2, enter =A2/(1-C2).
Format margin and markup cells as percentages with two decimal places. For data models in Power BI or DAX, prevent divide-by-zero errors by referencing Microsoft Learn’s DIVIDE function documentation to handle null values cleanly. Implementing these equations simplifies your profit margin vs markup calculations across large catalogs.
Frequently Asked Questions
Is a 50% markup the same as a 50% margin?
No. A 50% markup produces a 33.33% margin. A $100 item with 50% markup sells for $150 ($50 profit), equaling 33.33% of revenue.
Can profit margin exceed 100%?
Under ordinary business conditions with positive costs, profit margin cannot exceed 100%. Reaching 100% margin requires producing inventory at zero cost.
Can markup exceed 100%?
Yes. Markup regularly exceeds 100% in retail and luxury goods. Whenever an item sells for more than double cost, markup exceeds 100%.
Should a business use margin or markup for pricing?
Enterprises use both: markup is practical for setting shelf prices, while margin is essential for reporting. In operations, balancing profit margin vs markup ensures consistent pricing.
Does gross margin include every business expense?
No. Gross margin accounts only for direct Cost of Goods Sold. It excludes operating overhead like rent and taxes, which determine net margin.
What markup produces a 40% margin?
A markup of 66.67% produces an exact 40% margin: Markup = 0.40 ÷ (1 − 0.40) = 0.40 ÷ 0.60 = 66.67%.
What margin results from a 100% markup?
A 100% markup produces a 50% margin. Doubling cost creates profit equal to cost, representing half of selling price.
How do discounts affect margin?
Discounts compress margins rapidly because revenue drops while cost remains fixed. A 20% discount on $100 cuts margin from 40% to 25%.
Should payment-processing fees be included?
Yes. Pricing managers should include payment processing fees when evaluating profit margin vs markup to protect realized transaction earnings.
Summary
Mastering the distinction between profit margin vs markup is vital for commercial sustainability and pricing accuracy. To review: profit margin measures the percentage of revenue retained after covering costs, whereas markup reveals the percentage added to cost to establish a selling price. Because revenue exceeds cost on profitable sales, markup is always numerically higher than its corresponding margin percentage.
Confusing these two metrics causes underpricing and inaccurate forecasts. Whenever your team sets prices or evaluates supplier bids, ensure you choose the proper denominator. To test your pricing models instantly, explore EzzDo’s free Profit Margin Calculator today.
Disclaimer: This article provides commercial pricing principles and arithmetic formulas for educational purposes. It does not constitute formal accounting or tax advice. Businesses should consult a qualified accountant or financial adviser for organization-specific accounting guidance.